

Locally Adjusted Robust Regression
Abstract
Automatic human age estimation has considerable potential
applications in human computer interaction and
multimedia communication. However, the age estimation
problem is challenging. We design a locally adjusted robust
regressor (LARR) for learning and prediction of human
ages. The novel approach reduces the age estimation errors
significantly over all previous methods. Experiments on two
aging databases show the success of the proposed method
for human aging estimation.
1. Introduction
Human faces convey a significant amount of nonverbal
information for human-to-human communication. Our humans
have the ability to accurately recognize and interpret
faces in real time. Given a captured face image, various
attributes can be estimated from it, such as identity, age,
gender, expression, and ethnic origin [6]. Facial attributes
play a crucial role in real applications including multimedia
communication and Human Computer Interaction (HCI).
For example, if the user’s age is estimated by a computer, an
Age Specific Human Computer Interaction (ASHCI) system
may be developed. Such a system could be used for
secure internet access control in order to ensure young kids
have no access to internet pages with adult materials; A
vending machine can refuse to sell alcohol or cigarettes to
the underage people [19] [9]. In image and video retrieval,
users could retrieve their photographs or videos by specifying
a required age range [19].
However, automatic age estimation from human face images
is a challenging problem. The main difficulty is that
different persons age quite differently. The aging process
is determined by not only the person’s gene but also many
external factors, such as health, living style, living location
and weather conditions. Males and females may also age
differently. Figure 1 shows some face images with different
ages.
Figure 1. Face aging: each row shows images of the same individual
at different ages.
Surprisingly, there are only a few publications on age estimation
in the literature. Existing face-image-based age
estimation methods can be divided into three main categories
[5]: anthropometric model [17] [22], aging pattern
subspace [9], and age regression [18, 19, 24, 23]. The anthropometric
model uses the cranio-facial development theory
and facial skin wrinkle analysis. The growth related
changes of face shape and texture patterns are measured to
categorize a face into several age groups. Such methods
are suitable for coarse age estimation rather than continuous
or refined classification [17] or modelling ages just for
young people [22]. The AGing pattErn Subspace (AGES)
method [9] models a sequence of personal aging face images
by learning a subspace representation, in order to handle
incomplete data such as missing ages in the sequence.
The age of a testing face is determined by the projection in
the subspace that can best reconstruct the face image. For
the regression methods, the regression coefficients are estimated
from the training data with an assumption of the
regression function such as a Quadratic Model (QM) [19].
Yan et al. [24, 23] also dealt with the age uncertainty by
formulating a semi-definite programming problem [24] or
an EM-based algorithm [23]. Fu et al. showed the existence
of an aging manifold [5] visualized in face image subspaces
[8]. They suggested the fusion of manifold learning and a
quadratic regression model to improve the age estimation
performance.
The traditional quadratic model [19] for age regression is
based on a Least Square Estimation (LSE) criterion which
is not robust to outliers. The outliers could come from
some incorrectly labelled ages. In addition, the optimization
based on the LSE criterion minimizes the empirical
risk which usually cannot generalize well especially when
a small number of training data are available.
In this paper, we propose a novel method for automatic
age estimation. Our method is called a Locally Adjusted
Robust Regressor (LARR) for learning and prediction of the
aging patterns. The advantages of the proposed method will
be demonstrated with extensive experiments.
The remainder of the paper is organized as follows. In
Section 2, the quadratic regression function is introduced
which was used in previous approaches. In Section 3, we
introduce the support vector regression method which was
adopted as our robust regressor. A local adjustment of the
regression results is presented in Section 4. Experimental
evaluations of the proposed approach and comparisons with
previous methods are given in Section 5, and finally the conclusion
is provided in Section 6.
2. Quadratic Regression
Given the extracted features for each face image, people
usually took a regression function, L = f(x), to characterize
the relationship between the extracted features, x,
and the age labels, L. A typical choice of the regression
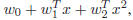
function, f, is the Quadratic Model (QM) [18],

 ,
where
,
where
 is the estimate of the age, w0
is the offset, x and x^2 are the extracted feature vector and
its square, and w1 and w2 are weight vectors.
The QM method has been used for age regression in previous
approaches [18] [19]. The model parameters are optimized
by minimizing the difference between the actual ages
of the individuals and the estimated ages. The loss function
usually corresponds to a Least Squares Estimation (LSE)
criteria. However, there are some disadvantages for the QM
method: (1) the aging is a complex nonlinear regression
problem, especially for a large span of years, e.g., 0-90. The
simple quadratic function may not model properly the complex
aging process; (2) the least square estimation is sensitive
to outliers that come from incorrect labels in collecting
a large image database; and (3) the least square estimate
criterion only minimizes the empirical risk which may not
generalize well for unseen examples, especially with a small
number of training examples. Therefore, we need to seek a
robust model for modelling the aging patterns.
For the purpose of robust aging regression, we adopt the
Support Vector Regression (SVR) method [25]. The SVR
might attack the three limitations of the traditional quadratic
regression model.
3. Support Vector Regression
The basic idea of SVR is to find a function f(x) that has
most ε deviation from the actually obtained target yi
for the
training data xi, and at the same time is as flat as possible.
In other words, we do not care errors as long as they are
less than ε. In comparison with the conventional
quadratic
loss function shown in Figure 2(a), the ε-insensitive
loss
function of SVR is shown in Figure 2(b).
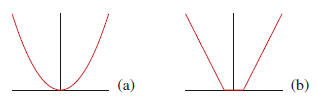
Figure 2. (a) quadratic regression loss function; (b) ε-insensitive
loss function.
Consider the problem of approximating the set of data
 with
a linear
with
a linear
function,

The optimal regression function [25] is given by
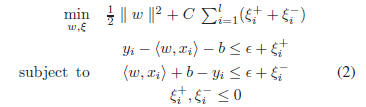
where constant C >0 determines the trade-off between the
flatness of f and data deviations, and
 are
slack variables
are
slack variables
to cope with otherwise infeasible constraints on the
optimization problem of (2). The ε-insensitive loss
function
as shown in Figure 2(b) is
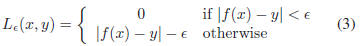
The primal problem of (2) can be solved more efficiently
in its dual formulation [25] resulting in the final solution
given by
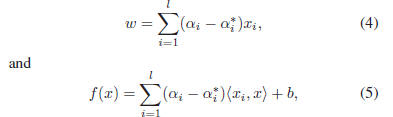
where
 are Lagrange multipliers. The value of b in
Eq. (1) can be determined by plugging Eq. (4) into Eq. (1)
[10].
A nonlinear regression function can be obtained by using
kernels, in the same manner as a nonlinear Support Vector
Machine (SVM) for classification [25]. Different kernels,
such as polynomials, sigmoid, or Gaussian radial basis
functions, can be used depending on the tasks. For our robust
age regression, the Gaussian radial basis function kernel
was adopted. A radial basis function is
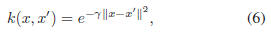
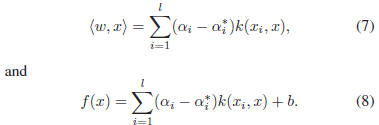
where γ is a constant to adjust the width of the Gaussian
function. Given the kernel mapping, the solution of the nonlinear
SVR is obtained as [25],
4. Locally Adjusted Robust Regression
Is it “good” enough for human age prediction using the
SVR? To answer this question, let us look at an estimation
result using the SVR. Figure 3 shows the predicted
ages (squares) with respect to the ground truth ages (circles).
Note that this is not a regression curve. One thousand
data points are sorted in ascending order of the ground truth
ages, i.e., from 0 to 91 years for females. The predicted
ages are obtained from the SVR method. From this figure,
we observe that the SVR method can estimate the global
age trend, but cannot predict the ages precisely. For example,
the SVR predictions give bigger age values for many
younger people, and smaller age values for some older people.
In some cases, the estimated age values could be far
away from the true ages, e.g., more than 40 years.
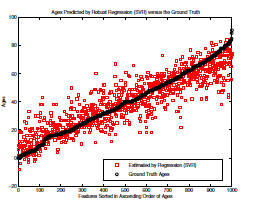
Figure 3. The true ages (circles) versus the estimated (squares) for
1,000 females
Why the SVR method cannot show better performance
than we expect for age prediction? The reason can be in two
aspects: First, the problem of age prediction is really challenging
because of the diversity of aging variation. Second,
the SVR method attempts to find a flat curve within a small
ε tube to approximate the data in order to obtain good
generalization
capability. But the age data may distribute like
the (green) irregular curve shown in Figure 4. One cannot
expect the SVR to estimate an irregular curve like this because
of the over-fitting problem. Further, one cannot assign
a large ε to enclose all true data points inside the
ε tube, as
demonstrated in motion estimation [12]. So how to model
the aging function by allowing the irregular distribution of
true ages?
4.1. Local Adjustment
One feasible solution is to adjust the age regression
values locally so that the estimated age values can be
“dragged” towards the true ages. We call it a Locally Adjusted
Robust Regressor (LARR). The idea of LARR is illustrated
in Figure 4. Suppose the predicted age value by
SVR is f(x), corresponding to the input data x. The point
f(x) is displayed by the black dot on the regression curve.
The estimated age, f(x), may be far away from the true age
value, L, shown as the red dot on the true age trajectory
curve. The idea of the LARR method is to slide the estimated
value, f(x), up and down (corresponding to greater
and smaller age values) by checking different age values,
t ∈ [f(x) − d, f(x) + d], to see if it can come up with a
better age estimation. The value d indicates the range of
ages for local search. Hopefully the true age value, L, is
also within this range, i.e., L ∈ [f(x) − d, f(x) + d].
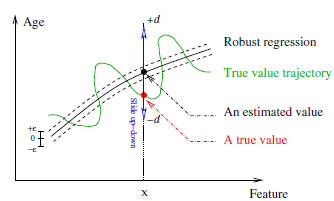
Figure 4. Illustration of the LARR idea.
Therefore the LARR method is a two-step procedure: (1)
a robust regression over all ages of the training data by using
the SVR method. This step can be considered as a global
regression process; (2) a local adjustment within a limited
range of ages centered at the regression result.
Now the key issue is how to verify different age values
within a specified range for the purpose of local adjustment.
Remember our goal is to “drag” the initially estimated age
value, f(x), by the global regressor, towards the true age,
L, as close as possible. We take a classification approach
to locally adjust or verify different ages, considering each
age label as one class. For our classification-based local adjustment,
there are many possible choices of classifiers, but
here we adopt a linear Support Vector Machine (SVM) [25]
for our local age adjustment. The main reason is that the
SVM can learn a classifier given a small number of training
examples, which has been demonstrated successfully in
problems such as face expression recognition [11], audio
classification [14], and image retrieval [13].
4.2. Limited Binary Tree Search
The classical SVMs deal with the two-class classification
problem. To extend to a multi-class classification, there
are three typical ways: (1) learning classifiers for each pair
of classes, and taking a binary tree search in testing [20]
[15]; (2) training SVMs for each class against all the remaining
classes; and (3) training SVMs for all classes simultaneously.
However, the last two schemes are not appropriate
for our purpose here. Because in our local adjustment,
only partial classes of age data are involved. If the
last two schemes are used, the SVMs have to be re-trained
dynamically for each adjustment, which is computationally
expensive. While in the first scheme there is no need to
re-train the SVMs. All pair-wise SVM classifiers can be
trained off-line, and only a limited number of classes are
involved in the binary tree search in testing.
In general, the number of pair-wise comparisons is n−1
for each test in an n-class classification problem [20] [15].
Here in our age adjustment, the number of pair-wise comparisons
is limited to m − 1 when only m classes are involved
in each local adjustment, and m < n.
5. Experiments
We perform age estimation experiments on a large
database, the UIUC-IFP-Y Aging Database. The database
contains 8,000 high-resolution RGB color face images captured
from 1,600 different voluntary Asian subjects, 800
females and 800 males, in the age range from 0 to 93
years. Each subject has 5 near frontal images with provided
ground truth ages. To our knowledge, this human age
database is the largest one ever reported.
For age estimation, we first use a face detector to find
the face area in each image, and label the eye corner locations
of each face subject. Based on the face and eye corner
locations, the face images are cropped, scaled, and transformed
to 60×60 gray-level patches. The grey-level values
of each face image are normalized to reduce the effect of
out-door illumination changes. The face image patches are
fed into a manifold learning module. We use the orthogonal
locality preserving projections [2] method for age manifold
learning, similar to the approach in [5]. Each face image
can be projected onto the age manifold to extract a feature
vector. We use the first 150 features for each face image.
The system then learns a robust regression function using
the kernel SVR method for females and males separately.
A small ε value was chosen, ε
= 0.02, for the loss function
in Eqn. (3). In SVR learning, parameters C and γ are
determined on a validation set. Different ranges such as 4,
8, 16, 32, and 64 were tried for the local adjustment of the
global regression results, and compared to see the effect of
local adjustment. The purpose of choosing the powers of
two is to simplify the binary search structure. The pair-wise
linear SVM classifiers were used for the local adjustment,
centered at the age value (or label) obtained from the global
regressor.
To evaluate the accuracy of our algorithms for age estimation
on the UIUC-IFP-Y age database, we perform a
standard 4-fold cross validation test. The test was executed
on the female and male subsets separately. The reason is
that we found females and males age quite differently in the
database. The performance of age estimation can be measured
by two different measures: the Mean Absolute Error
(MAE) and the Cumulative Score (CS). TheMAE is defined
as the average of the absolute errors between the estimated
ages and the ground truth ages,
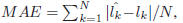
where lk is the ground truth age for the test image
 is
is
the estimated age, and N is the total number of test images.
The MAE measure was used previously in [19] [18]
[9] [24]. The cumulative score [9] is defined as CS(j) =
 is the number of test images
on which the age estimation makes an absolute error
no higher than j years.
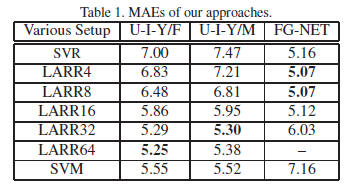
Experimental results are shown in Table 1 and Figure 5
(a) and (b). The first and second columns in Table 1 show
the MAEs for females and males in the UIUC-IFP-Y age
database, separately. Different ranges, e.g., 4, 8, 16, 32, and
64, were tried for local adjustment of the global regression
results. One can see that the local adjustment truly reduces
the errors of the global regression. Different ranges of adjustment
do have different MAEs. For comparison, we also
show the results using purely the SVM classifiers in the last
row. The best LARR result in terms of MAE is 5.29 years
for females when the local search range is 64 classes, while
it is 5.30 years for males when the adjust range is 32 classes.
The ranges of local adjustment depend on the data and the
global regression results.
The CS measures are shown in Figure 5 (a) and (b)
for females and males, separately. One can observe that
the LARR methods (with different ranges for local adjustment)
improve the score significantly over the pure regression
method especially for lower error levels, e.g.,m < 10
years. We do not show the cumulative scores for 4 and 8
classes here in order to not mess up the figures. Those two
CS curves are even lower than 16 classes.
curves are even lower than 16 classes.
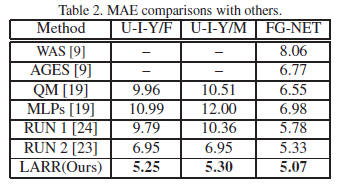
We also compare our results with all previous methods
reported on the UIUC-IFP-Y age database. As shown in
Table 2, our LARR method has the MAEs of 5.25 and 5.30
years for females and males, separately, which are explicitly
smaller than all previous results. Our method brings about
24% deduction of MAEs over the best result of previous approaches.
The comparisons of cumulative scores are shown
in Figure 6 (a) and (b).
There is a public available age database, the FG-NET
[1]. In this age database, the age ranges from 0 to 69 years,
and each face image has 68 labelled points characterizing
shape features. The shape features can be combined with
appearance features to form a face representation, called
Active Appearance Models (AAMs) [3]. The AAMs use
200 parameters to model each face for the purpose of age
estimation [9] [24] [23]. To evaluate our LARR method on
FG-NET, we use the same AAM features as in [9] [24] [23].
A test strategy, called Leave-One-Person-Out (LOPO),
was usually taken for the FG-NET age database [9] [24]
[23]. We follow the same strategy and compare our results
with previous ones. The experimental results are shown in
the third column of Tables 1 and 2. One can see that our
LARR method has an MAE of 5.07 years which is lower
than all previous methods listed in Table 2. Our best MAE
was obtained using either 4 or 8 classes for local adjustment
as shown in Table 1. Increasing the local search ranges for
the LARR method will make the errors bigger.
The cumulative scores of our LARR method on the FGNET
database are shown in Figure 5 (c). LARR8 means using
8 classes for local adjustment. The cumulative scores of
the pure SVM are much lower than the pure SVR for most
error levels, which indirectly indicates the significance of
constraining the SVM search in a local range. The cumulative
score comparisons are shown in Figure 6 (c). Our
LARR method performs much better than the QM an MLP
methods. The method of RUN1 [24] is close to our LARR
in low age error levels, but worse than LARR in high levels.
In contrast, the method of RUN2 [23] is close to our LARR
in high age error levels, but worse than the LARR in low error
levels. Overall, our LARR method has higher accuracy
than both the RUN1 and RUN2 on the FG-NET database.
From the experimental evaluations, we summarize that
(1) the LARR method gives better age estimation than the
purely robust regression by SVR or purely classification by
SVM, and (2) the LARR method has lower errors than all
the state-of-the-art approaches to age estimation.
6. Conclusion
We have presented a new approach to automatic age
estimation.
The Support Vector Machine (SVM) and Support
Vector Regression (SVR) methods are investigated for
age prediction for the first time. A Locally Adjusted Robust
Regressor (LARR) was designed to estimate ages with
high performance. Experimental evaluations on a large age
database and the public available FG-NET database show
that our LARR method performs better than all the state-ofthe-
art approaches. We expect to see more applications of
the LARR method to other challenging real problems.